

Spectroscopy in organic chemistry (pt. 1)
- Benjamin Hui
- Mar 28, 2019
- 6 min read
Back in the day, when organic chemistry was still in its infancy, the only tools available to chemists for figuring out molecular structures were chemical tests for functional groups, and physical tests for properties such as melting and boiling points. These, and good old fashioned deductive work. Even so, misidentification was commonplace, and molecular structures were constantly being corrected. All this changed with the quantum leap in technological advancement that took place as the age of electronics dawned, making it possible to construct analytical devices that would help us greatly in our endeavour. The majority of these machines are based on spectroscopy - the study of how electromagnetic (EM) radiation interacts with matter, and in the context of organic chemistry, organic molecules. The most common spectroscopies used in organic chemistry are infrared (IR) and nuclear magnetic resonance (NMR) spectroscopies. The former irradiates the sample with infrared radiation, hence the name, while the latter does so with radio frequency (RF) waves.
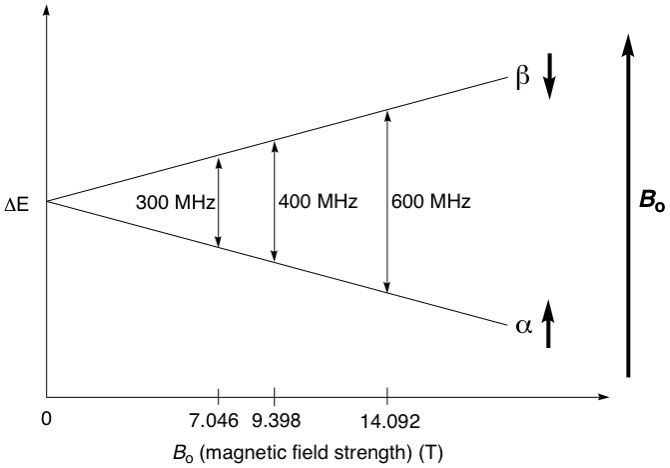
These two spectroscopies target different aspects of molecules. IR spectroscopy causes chemical bonds to vibrationally resonate (more on this below). NMR spectroscopy causes the spins of atomic nuclei to flip. But the general idea of spectroscopy remains consistent: a molecule is irradiated by a certain type of EM radiation, has a certain aspect of it excited by the radiation, and the outgoing radiation is picked up by a detector and translated into interpretable information.
I will split this article into two parts: This one discussing IR spectroscopy, and the second part about NMR spectroscopy.
Infrared Spectroscopy
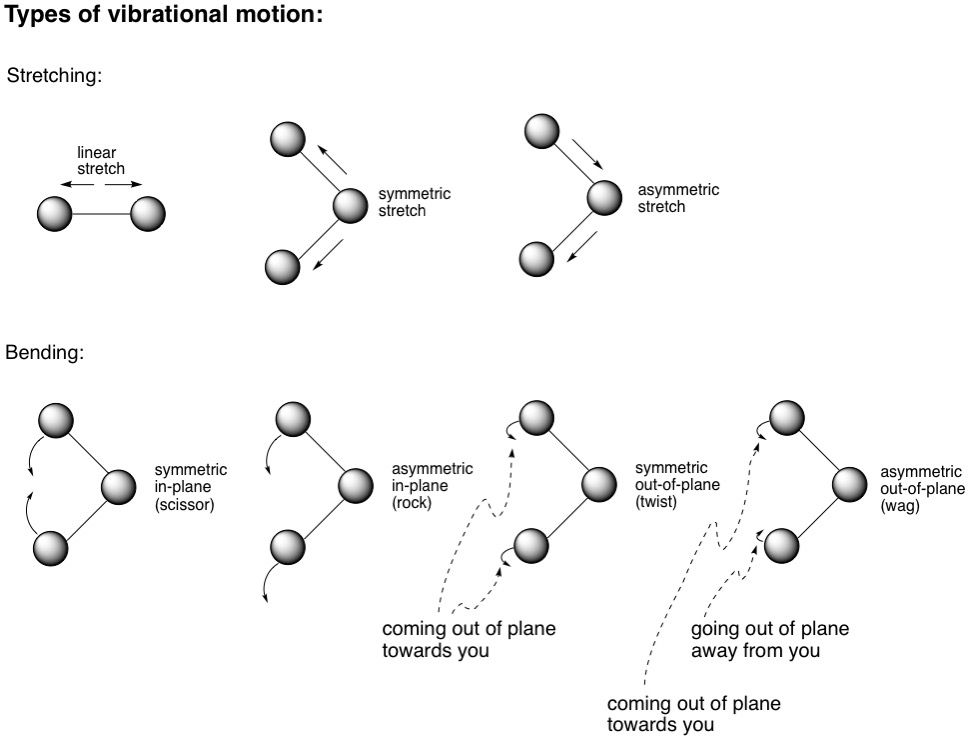
Real chemical bonds aren't rigid like those sticks in your molecular model kits. Instead, they are in constant vibrational motion; stretching, compressing and bending. Some examples of these are shown in the diagram below. These vibrations correspond to certain energies, and if incoming radiation has similar energy, it will be absorbed and the vibrations will constructively intensify (resonate), much like how you can make larger and larger waves if you patted a water surface at the same frequency as the waves. It just so happens that the energies corresponding to these vibrations are in the infrared range (0.7 - 1000 microns wavelength). For convenience, the wavenumber ṽ is used, which is the number of wavelengths per centimetre and is calculated by the formula ṽ = 1/ƛ, where ƛ is the wavelength. Therefore, the higher the wavenumber, the higher the energy.
Now, different types of bonds absorb at different IR wavelengths, and correspondingly, wavenumbers. We can now do some spectroscopy! IR spectrometers irradiate a sample over a range of wavenumbers, typically from 400 - 4000 cm^-1. When a particular bond absorbs at a certain wavelength, less of that wavelength reaches the detector. So once the scan is complete, the spectrometer plots the % transmittance (how much radiation reached the detector) against the wavenumber. Plot regions that are attenuated are signals that indicate radiation at those wavenumbers was absorbed by certain bonds in the molecule. An IR spectrum is, in a sense, a fingerprint of a molecule. It is very unlikely that two different molecules have identical IR spectra. In fact, an entire region of an IR spectrum (from 600 - 1400 cm^-1) is referred to as the fingerprint region, while the region from 1400 - 4000 cm^-1 is known as the functional group region. Ironically though, we are less concerned with the fingerprint region than the functional group region, mainly because the fingerprint region characterizes the C-H bending vibrations in the molecule, which virtually every organic molecule is teeming with, and therefore the sheer overlapping of signals in this region renders it almost useless in compound identification. Therefore, only the functional group region can give us some useful information about a molecule.
By now, you might have doubts if IR spectroscopy can actually tell us about the structure of a molecule, and you would be right: It can't. What it can tell us is what kind of functional groups are present, based on their characteristic absorption at certain wavenumbers, and also the intensity of the signals. If you look at a typical IR spectrum (an example below), you will see that some of the signals are very sharp and strong (low % transmission), some less so, and some broad ones. All these are indicative of certain functional groups.

Looking at the functional group region of this compound, we see some very distinct signals: First, a sharp and intense one at around 1700 cm^-1, indicating the presence of a carbonyl C=O group. Second, a medium intensity jagged peak at 3000 cm^-1, characteristic of C-H stretching, but not very useful because practically every organic compound will show these. Third, a broad peak at around 3400 cm^-1, indicative of a hydroxyl O-H stretch.
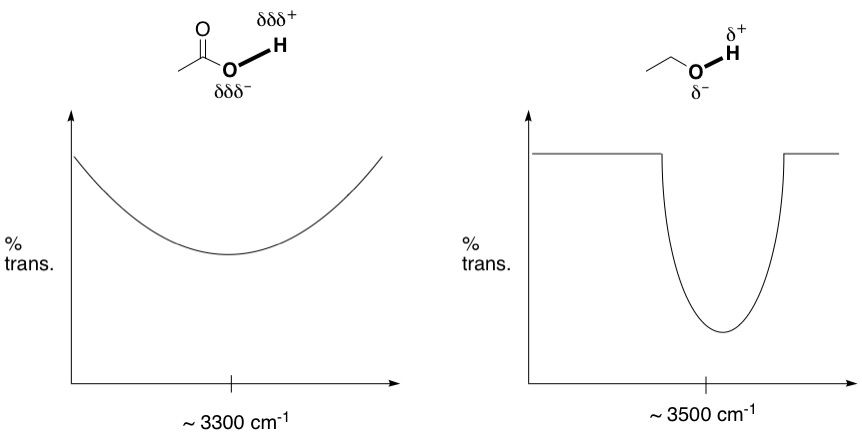
All this information is good, but all we've been able to do is identify what kinds of bonds are present in the molecule. In fact, we don't even know if the carbonyl group is part of a ketone, aldehyde or ester, or if the hydroxyl is an alcohol or part of a carboxylic acid group. We need to dig deeper. Let's start with the OH signal. Turns out, the signals for an alcohol OH and a carboxylic OH look very different. What we have resembles an alcohol OH a lot more. Carboxylic OH signals are always extremely broad, like a speed bump. The figure below shows the rough difference between the two. Why is that? Recall that OH groups are capable of hydrogen bonding, and the carboxylic OH is much better at it because the bond is much more polarized than an alcohol OH. This is why the carboxylic group is acidic; the O-H bond is weak and breaks easily to release the proton. So, because of this strong hydrogen bonding, the O-H bond stretch is in a perpetual state of flux, varying across a wide range of frequencies depending on how hydrogen bonded it is at any given moment of time. Therefore, this bond absorbs at a wide range of frequencies and shows up as a speed bump. Alcohol OHs are also able to hydrogen bond, but since they're not as strong as their carboxylic counterparts, there is less signal broadening. We see the same situation in N-H bonds too; since they're able to hydrogen bond, they also display signal broadening.
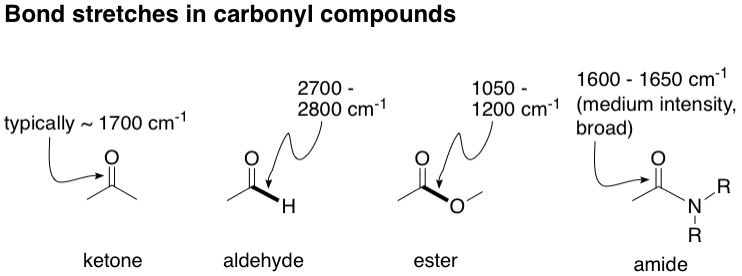
Next, we have the carbonyl C=O group. It's almost impossible to differentiate aldehydes, ketones, esters and amides based on their carbonyl signals alone because they look almost identical and show up at pretty much the same area (~ 1700 cm^-1). So we need to look for other potential signals to help us by looking for other unique bonds in the vicinity of the carbonyl. In esters, we see that there is another oxygen bonded to the carbonyl carbon in a single bond. This C-O bond in fact has a characteristic strong, single peak usually found at around 1050 - 1200 cm^-1. Looking at the spectrum, we don't find anything resembling this, so we can rule out the ester. Moving on to aldehydes, there is a hydrogen bonded to the carbonyl carbon in a single bond. This C-H stretching has a characteristic strong signal at around 2700 - 2800 cm^-1. Looking at the spectrum, we don't see anything there, so it's not an aldehyde. Amide C=O bonds usually show up at a slightly lower wavenumber, around 1600 - 1650 cm^-1, and the signal is usually broadened as well relative to the other carbonyl compounds. Why? If you recall, amides can undergo resonance where the carbonyl bond shuttles between a single and double bond. Like the carboxylic OH, this bond strength of this bond is therefore perpetually in flux, and therefore its signal broadens and becomes less intense. We don't see a broadened signal in our example, and therefore, by elimination, we conclude that this carbonyl signal must belong to a ketone.
There are lists widely available summarizing the different kinds of bonds and their characteristic signals. Click here for a list that I frequently use. Usually, there is no need to memorize the signals because lists are frequently provided with tests and exams. But it is always useful to remember some key absorptions, like carbonyls and hydroxyls.
So, IR spectroscopy can conclusively identify what functional groups are present in a molecule after a process of spectrum analysis and deduction. This, unfortunately, is the limit of its capability. IR spectroscopy cannot tell us the molecular weight of the compound, nor can it tell us how the functional groups are arranged in the molecule, nor give us any information about its structure. To figure out molecular structure, we turn to NMR spectroscopy, which will be discussed in part two.


Comments